Prometheus and Grafana are not alternatives to each other. Prometheus is a time-series database and scraper that pulls metrics from your infrastructure. Grafana is a visualization and alerting frontend. You almost always run them together, not instead of each other.
Understanding this distinction saves weeks of confused evaluation. The real decision is whether this stack fits your observability model, and if so, how to deploy it.
What Prometheus Does
Prometheus scrapes HTTP endpoints on a schedule (default 15 seconds) and stores the metrics it finds in its embedded time-series database. It's pull-based, not push-based. Your applications expose a /metrics endpoint in Prometheus text format, and Prometheus asks for it repeatedly.
This pull model has consequences. It means Prometheus must be able to reach your targets—network-accessible, no authentication required by default, no firewall blocking. If you're monitoring 50 servers across three data centers, Prometheus needs line-of-sight to all of them. If a target goes down, Prometheus marks it as "down" but keeps the old data; it doesn't lose history.
Prometheus includes a basic UI for querying metrics using PromQL, its custom query language. The UI is functional but not designed for dashboards or long-term visibility. It's a developer tool, not a control panel.
Storage is local and bounded. By default, Prometheus keeps 15 days of data on disk. You can tune this, but it's not designed as a long-term archive. For retention beyond weeks, you need a remote storage backend (Thanos, Cortex, or a cloud service).
What Grafana Does
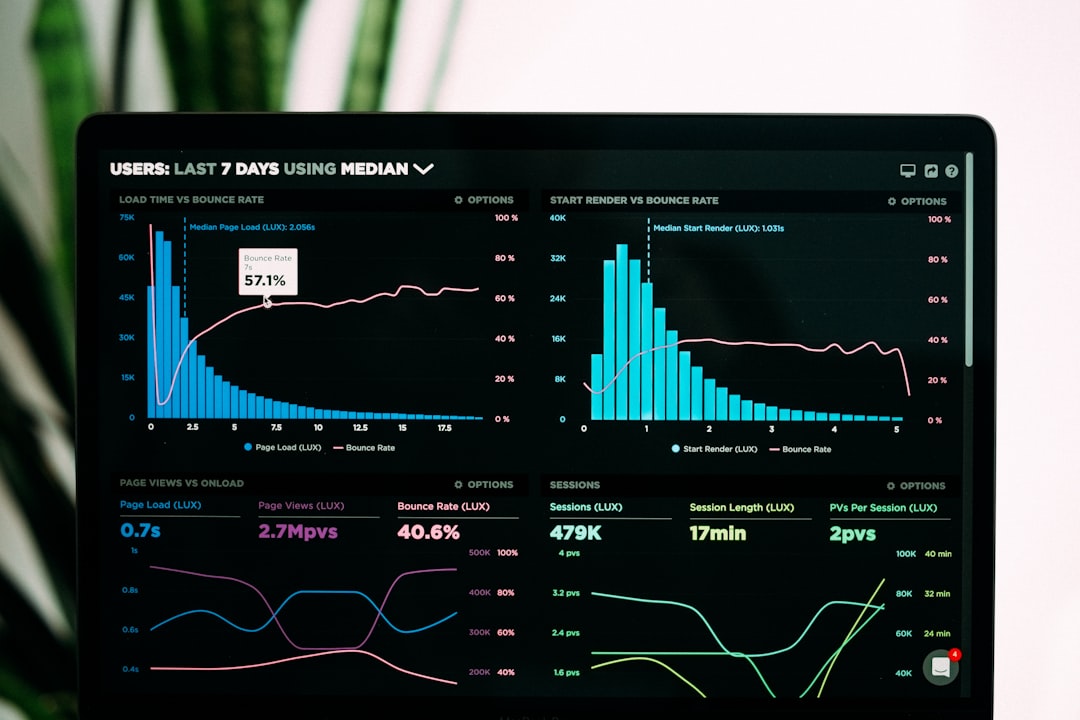
Grafana connects to Prometheus (or any other time-series database) and builds dashboards from PromQL queries. A dashboard is a set of panels—graphs, tables, gauges, heatmaps—each bound to a query. You can set thresholds, change colors, add annotations, and share the result with your team.
Grafana also handles alerting. You define alert rules in Grafana, and when a condition is met, Grafana sends notifications to Slack, PagerDuty, email, or a webhook. This is separate from Prometheus's native alerting (Alertmanager), though both can coexist.
Grafana is stateless. It stores dashboard definitions, user accounts, and alert rules in a database (SQLite by default, PostgreSQL in production), but it doesn't store metrics. All metric data lives in Prometheus. This means you can restart Grafana without losing any historical data.
The Monitoring Stack: How They Wire Together
A minimal setup looks like this:
- Your app or server exposes metrics at
http://localhost:9090/metrics - Prometheus scrapes that endpoint every 15 seconds and stores the data
- Grafana queries Prometheus using PromQL when you view a dashboard
- Grafana evaluates alert rules every 1–5 minutes and sends notifications if thresholds are crossed
Prometheus and Grafana communicate only when needed. Grafana doesn't poll Prometheus continuously; it fetches data on-demand when you load a dashboard or when an alert rule is evaluated.
You can run both in containers. A typical Docker Compose setup is 50 lines: Prometheus container with a config file that lists scrape targets, Grafana container with a data source pointing to Prometheus, and maybe a node-exporter container to expose system metrics. If you want a broader look at structuring this kind of setup, the writeup on devbox.id covers containerizing development workflows in practical detail.
Where They Differ (and Why It Matters)
Metric Collection: Prometheus scrapes; you must expose endpoints. Grafana cannot scrape anything. If you want to collect metrics from applications that don't expose Prometheus format, you need an exporter (a sidecar that translates proprietary formats into Prometheus format). Grafana has no role here.
Query Language: Prometheus uses PromQL, a specialized language for time-series math. Grafana uses PromQL when querying Prometheus, but also supports SQL, Elasticsearch, CloudWatch, and dozens of other backends. If you switch from Prometheus to InfluxDB, Grafana adapts; Prometheus is tied to its own format.
Alerting Philosophy: Prometheus alerting is rule-based and stateless. Alertmanager (a separate component) deduplicates, groups, and routes alerts. Grafana alerting is simpler: condition met, send notification. Prometheus alerting scales better for large rule sets; Grafana alerting is easier to set up for small teams.
Storage: Prometheus is built-in and ephemeral. Grafana is stateless. If you need months of history, Prometheus alone won't cut it—add Thanos or a remote backend. Grafana doesn't help here.
When This Stack Breaks
High-cardinality metrics: If a metric has thousands of unique label combinations (e.g., one label per user ID), Prometheus's memory footprint explodes. Grafana won't help; the problem is upstream in Prometheus. Solution: reduce cardinality or use Cortex, a distributed Prometheus.
Unreliable networks: Prometheus scrapes over HTTP. If targets are behind NAT, on intermittent connections, or in ephemeral environments (Kubernetes pods), scrape failures are common. Grafana can't fix this; you need a push-based system (Telegraf, Datadog, or Prometheus remote write).
Long-term retention: Prometheus alone keeps 15 days. If compliance requires a year of data, you must add remote storage. Grafana doesn't store anything, so it can't help. This is an architectural gap, not a Grafana limitation.
Authentication and multi-tenancy: Prometheus has no built-in auth. Grafana has RBAC and org isolation. If you need to expose Prometheus metrics to untrusted users, Grafana won't help—you need a reverse proxy or a managed service. If you need to isolate teams in Grafana, both can do it, but Prometheus data is global.
Alerting at scale: Grafana alert evaluation is not distributed. If you have thousands of rules, evaluation becomes slow. Prometheus + Alertmanager is designed for this. For large teams, prefer Prometheus alerting.
The Decision Framework
Choose Prometheus + Grafana if:
- You control your infrastructure (servers, Kubernetes clusters, VMs).
- Your applications can expose HTTP endpoints.
- You're comfortable with pull-based collection.
- You need dashboards and basic alerting.
- Your retention needs are weeks, not years.
Avoid this stack if:
- You need push-based collection (serverless, IoT, unreliable networks).
- You require multi-tenancy or strong isolation.
- You need compliance-grade long-term storage.
- Your team is unfamiliar with PromQL.
For push-based or highly distributed systems, consider Telegraf + InfluxDB or a managed service like Datadog. For Kubernetes-native monitoring, Prometheus is the de facto standard, and Grafana is the obvious frontend. Choosing where to host this stack also has real performance implications—the benchmark VPS Indonesia vs Singapura comparison is worth reading if latency to your scrape targets is a concern.
One-Line Takeaway
Prometheus scrapes and stores; Grafana visualizes and alerts. They're a pair, not competitors—pick them as a unit or pick something else entirely.