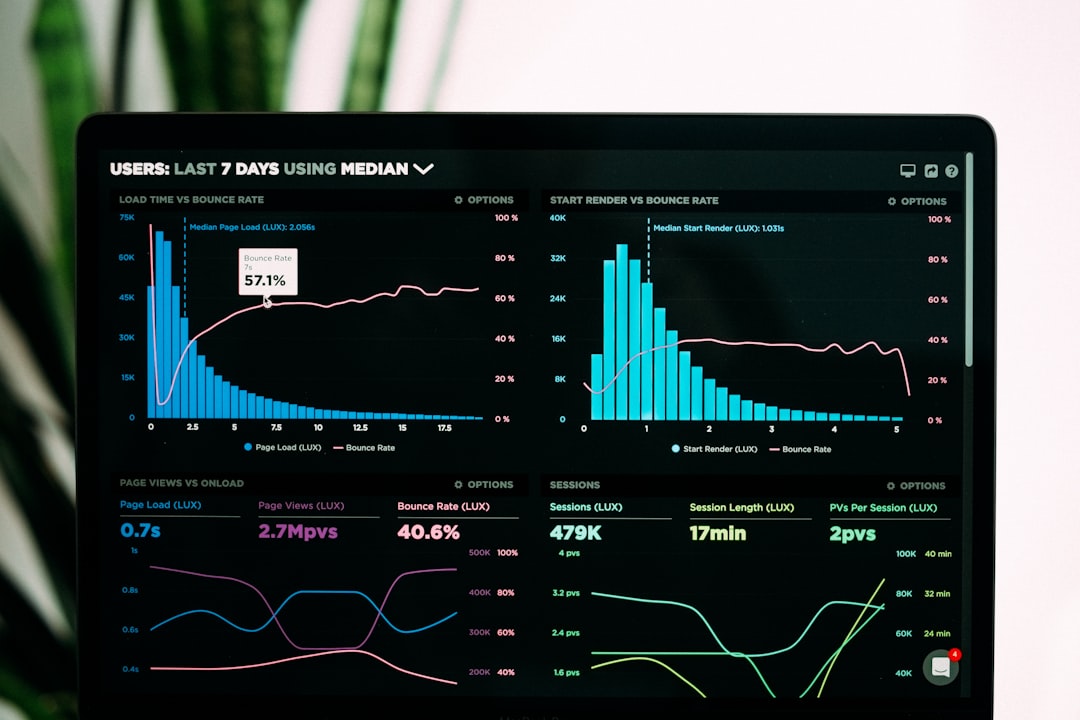
Grafana and Datadog solve the same problem—visibility into server health—but through opposite architectures. Grafana is a visualization layer you control; Datadog is a managed platform that owns the entire pipeline from collection to alerting. Neither is universally better. The choice hinges on three variables: budget, operational overhead, and whether you want to own the infrastructure.
The Core Difference
Grafana does not collect data. It queries data you already have—Prometheus, InfluxDB, Elasticsearch—and renders dashboards. You run Grafana as a service (on a VM, Kubernetes, or managed hosting). You own the agents, the retention policies, and the query logic.
Datadog collects, stores, and visualizes in one product. You install the Datadog Agent on your servers. It ships metrics, logs, and traces to Datadog's infrastructure. You build dashboards in Datadog's UI. You never see the backend.
This split defines everything downstream.
The Cost Model
Grafana's cost is infrastructure: compute for Grafana itself, storage for your time-series database, and your time to operate both. Grafana is open-source and free to run. If you self-host on a $50/month VM and maintain a Prometheus cluster, your marginal cost per server is near zero after the first ten machines.
Datadog charges per host per month, plus overage for logs and custom metrics. A single server costs $15–$20/month on the standard plan. At 50 servers, you're paying $750–$1000/month before logs. At 500 servers, the math shifts: Datadog becomes $7,500–$10,000/month. Grafana plus Prometheus on modest hardware might cost $500–$1500/month in total.
Grafana wins on unit economics at scale. Datadog wins if you have fewer than 20 servers or zero appetite for database operations. If you're running a lean stack and need a reliable host for your Grafana VM, VPS Indonesia terbaik untuk toko online covers some hosting options worth considering for cost-conscious setups.
Operational Load
Grafana requires you to run and maintain three separate systems: the visualization layer, the time-series database, and the collection agents (Prometheus Node Exporter, or equivalent). You define scrape intervals, retention, alerting rules, and dashboard code. You upgrade Grafana, patch Prometheus, and debug cardinality explosions when a new service starts emitting unbounded labels.
Datadog abstracts all of this. You install one agent, configure it once, and the backend handles the rest. Datadog manages upgrades, scaling, and retention. You never think about cardinality or query performance—Datadog's infrastructure absorbs the load.
If you have a dedicated platform or SRE team, Grafana's operational burden is acceptable. If you're a three-person startup, Datadog's simplicity has value.
Data Ownership and Retention
With Grafana, your metrics live in your database. You control retention policies, export formats, and query access. If you want to keep five years of historical data, you pay for storage and manage it. If you want to query raw metrics via API, you can. Your data is yours.
Datadog retains metrics for 15 months by default. Custom metrics are retained for 3 months unless you pay for extended retention. You cannot export bulk metrics; you query through Datadog's API. If Datadog changes pricing or you decide to leave, extracting historical data is difficult. Your data is Datadog's asset, licensed to you.
This matters for compliance, long-term trend analysis, and multi-year capacity planning. Regulated industries often require this level of control.
Feature Comparison
Both platforms offer dashboards, alerts, and anomaly detection. Datadog's anomaly detection and forecasting are more mature and require less tuning. Grafana's alerting has improved significantly (Grafana Alerting, Loki for logs) but remains less polished.
Datadog integrates with 600+ services out-of-the-box: AWS, GCP, Kubernetes, databases, CI/CD platforms. Grafana integrates with fewer services natively, but its data-source plugin ecosystem is deep. If you're using a standard stack (AWS + Kubernetes + Postgres), Datadog's integrations save weeks of work.
For log aggregation, Datadog is unified: metrics, logs, and traces in one product. Grafana requires Loki (for logs) and Tempo (for traces) as separate components. This fragmentation adds operational complexity but gives you modularity—you can adopt each piece independently.
When Grafana Wins
Choose Grafana if:
- You have 100+ servers (cost becomes prohibitive with Datadog).
- You need long-term data retention or offline querying.
- You already run Prometheus or another time-series database.
- Your team has database operations experience.
- You operate in an air-gapped or on-premises environment where SaaS is not an option.
When Datadog Wins
Choose Datadog if:
- You have fewer than 50 servers and want to minimize operational overhead.
- You need out-of-the-box integrations with your cloud provider or third-party services.
- Your team lacks time-series database expertise.
- You value Datadog's anomaly detection and forecasting algorithms.
- You want a single pane of glass for metrics, logs, and traces without integrating separate tools.
Trade-Offs
Grafana trades simplicity for control. You get flexibility and cost savings; you pay in operational complexity and time-to-insight. Debugging a misbehaving Prometheus scrape job takes hours. Tuning alert thresholds requires understanding your data distribution.
Datadog trades control for simplicity. You get fast onboarding and mature algorithms; you pay in cost and vendor lock-in. Leaving Datadog means rebuilding your alerting rules and dashboards elsewhere.
Neither is wrong. The decision is contextual: team size, budget, and risk tolerance.
The Hybrid Approach
Many organizations run both. Use Datadog for application performance monitoring (APM) and high-cardinality data where its pricing makes sense. Use Grafana + Prometheus for infrastructure metrics and long-term retention where you need cost control. This adds operational complexity but optimizes for both cost and capability. Teams that also rely on mobile tools to stay on top of alerts on the go may find this guide useful for rounding out a lean monitoring workflow.
One-Line Takeaway
Grafana is cheaper and more flexible at scale; Datadog is simpler and faster to deploy. Pick based on server count, team capacity, and how long you plan to retain data.