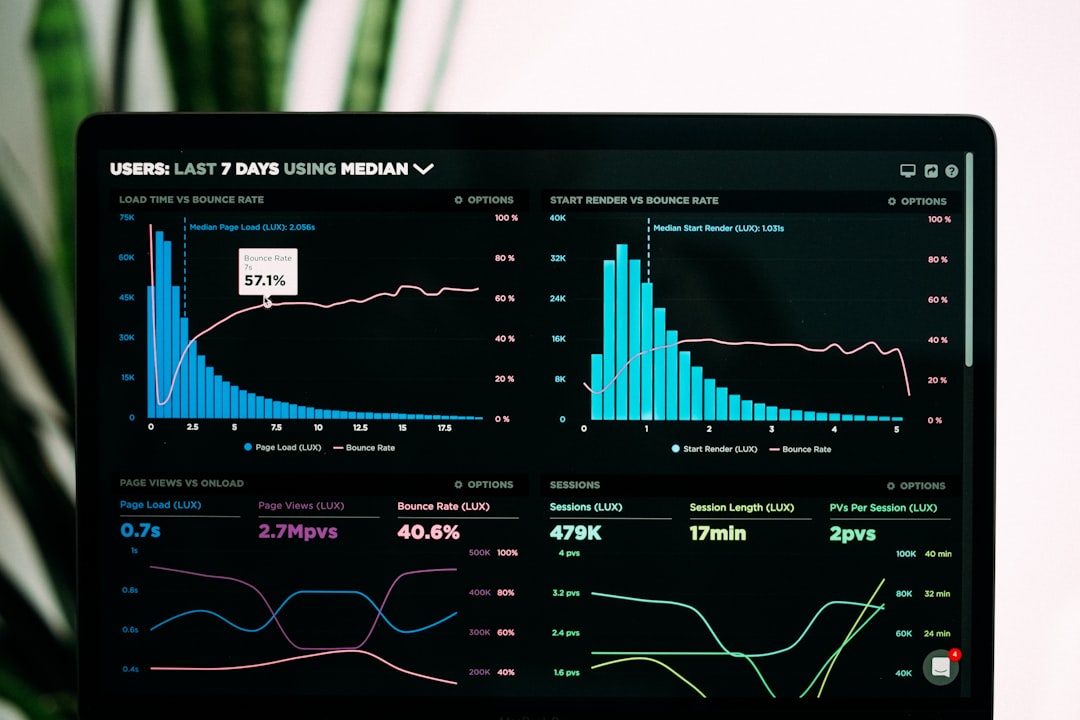
Linux monitoring tools fall into three categories: metrics collectors, visualization layers, and log aggregators. Each solves a distinct problem; most production setups use at least two. The right choice depends on your scale, team size, and how much operational visibility you actually need.
The Core Three Patterns
Metrics monitoring tracks system state over time: CPU, memory, disk, network. Logs capture discrete events and errors. Tracing follows a single request across services. You need all three for serious troubleshooting, but you can start with metrics and add the rest as scale demands.
The mental model: metrics answer "what is happening now"; logs answer "what happened and why"; traces answer "where did this request go". A CPU spike (metric) sends you to logs to find which process spiked, then to traces if that process is distributed.
Prometheus: The Metrics Standard
Prometheus scrapes metrics from targets at regular intervals and stores them in a time-series database. It's pull-based, not push-based—Prometheus asks each server "what's your current state" rather than waiting for servers to send data. This matters: pull-based systems are easier to debug and require no agent configuration on the target side.
Setup: Install Prometheus on a central monitoring server. Configure it to scrape /metrics endpoints from your servers (usually via a Node Exporter agent). Query language (PromQL) is powerful but has a learning curve. Retention is local disk by default; production setups add remote storage (Thanos, Cortex) for long-term data.
Gotcha: Prometheus stores data locally and doesn't cluster. A single Prometheus instance becomes a bottleneck at ~1 million metrics/second. Plan for federation or remote storage early if you're growing.
Grafana: The Visualization Layer
Grafana reads from Prometheus (or other data sources) and renders dashboards. It's not a database; it's a query interface and rendering engine. Separate the concerns: Prometheus collects and stores, Grafana displays.
Why this matters: You can swap data sources without rewriting dashboards. You can use Grafana with InfluxDB, Graphite, or Elasticsearch just as easily. This flexibility is why Grafana dominates—it's agnostic to your backend.
Setup is straightforward: point Grafana at your Prometheus instance, create a data source, build dashboards with PromQL queries. Alerting rules live in Prometheus; Grafana can trigger notifications (email, Slack, PagerDuty) based on those rules.
Gotcha: Grafana dashboards are easy to create but hard to maintain. A team with ten custom dashboards drifts into inconsistency. Use dashboard-as-code (Jsonnet, Grafonnet) or a curated library (Grafana Labs publishes community dashboards) to avoid dashboard sprawl.
ELK Stack: Logs at Scale
Elasticsearch + Logstash + Kibana (or Filebeat instead of Logstash) is the industry standard for log aggregation. Filebeat ships logs from each server to Elasticsearch; Kibana queries and visualizes them.
Elasticsearch indexes logs, making them searchable by any field. Kibana's interface lets you filter, aggregate, and trend logs without writing queries. This is where you find the root cause after a metric alert fires.
Setup: Deploy Filebeat agents on each server, point them at Elasticsearch, configure which log files to ship. Elasticsearch does the indexing; Kibana provides the UI. Index rotation (daily, weekly) keeps storage manageable—old logs are deleted or archived.
Gotcha: Elasticsearch is resource-hungry. A single node with 8GB RAM can handle ~100 servers' logs comfortably; beyond that, you need a cluster. Cluster setup is complex: master nodes, data nodes, ingest nodes all have different roles. Start small and add nodes when you hit limits, not before.
Loki: The Lightweight Alternative
Loki is Grafana's answer to ELK. It indexes log labels (like "server=web-01") rather than every field, making it far cheaper to run. Logs are stored as compressed streams, not inverted indexes.
Trade-off: You can't search arbitrary fields as easily. If you need to find all logs containing a specific error message, Loki requires you to search within already-filtered streams. This is slower than Elasticsearch for free-form queries but faster and cheaper for label-based filtering.
Setup mirrors ELK: Promtail agents ship logs to Loki, Grafana queries Loki. Same operational pattern, lower resource cost. Good fit for teams with <50 servers or those already using Grafana.
Telegraf + InfluxDB: Simpler Metrics
Telegraf collects metrics and sends them to InfluxDB, a time-series database optimized for metrics. Unlike Prometheus (pull), this is push-based: Telegraf pushes data to InfluxDB.
Why choose this: InfluxDB is simpler to operate than Prometheus at small scale. No scrape configuration, no service discovery complexity. Query language (InfluxQL or Flux) is more SQL-like than PromQL.
Trade-off: Push-based systems require agents on every target. If an agent breaks, you lose visibility. Pull-based systems (Prometheus) fail more gracefully—if a target is down, Prometheus marks it stale but still has historical data.
Choosing Your Stack
Small teams (< 20 servers): Prometheus + Grafana + Loki. Minimal operational overhead, all open-source, excellent ecosystem.
Mid-size (20–200 servers): Prometheus + Grafana + ELK or Loki. Add Alertmanager for alert routing. Consider a managed option (Datadog, New Relic) if operational burden is high. If you're running these workloads on cloud infrastructure, the VPS Indonesia terbaik untuk bisnis comparison on tinjauhost.biz.id covers how local versus international providers handle the resource demands of stacks like this.
Large scale (200+ servers): Prometheus with remote storage (Thanos) + Grafana + ELK + distributed tracing (Jaeger, Tempo). Separate teams for metrics and logs. Invest in infrastructure-as-code and runbooks.
When This Breaks
Metrics are lost if your monitoring server dies and you have no remote storage. Back up Prometheus data or use remote storage from day one.
Logs fill disk quickly. A single server generating 1GB/day of logs will fill a 1TB disk in ~3 years. Set retention policies and archive old logs to cold storage.
Alerts stop working if the alerting system is down. Monitor your monitoring—set up a separate, simple health check that pages you if Prometheus itself is unreachable.
Dashboards become stale. Ownership matters: assign each dashboard to a team and review quarterly.
The Operational Reality
You don't need all three categories immediately. Start with Prometheus + Grafana for metrics. Add logs when you can't debug from metrics alone. Add tracing when you have microservices and latency is your bottleneck.
The best monitoring tool is the one your team will actually maintain. A perfect stack nobody understands is worse than a simple stack everyone knows. Invest in runbooks and training before you invest in tools.
Monitoring is not a fire-and-forget install. Plan for ongoing tuning: alert thresholds drift, dashboards need updates, new services require new metrics. Budget 10–15% of on-call time for monitoring maintenance.
Start with the pattern: metrics for state, logs for events, traces for causality. Choose tools that fit that model and your team's expertise. The Linux monitoring ecosystem is mature; any of these choices will work. The difference is in operational cost and learning curve, not capability.